PanoTac Explained: Spatial Pressure, Shear Feedback and Hardware Limits
A practical reading of dense contact and sparse magnetic sensing: what the fused grid represents, which tasks benefit and what remains unverified for integration.
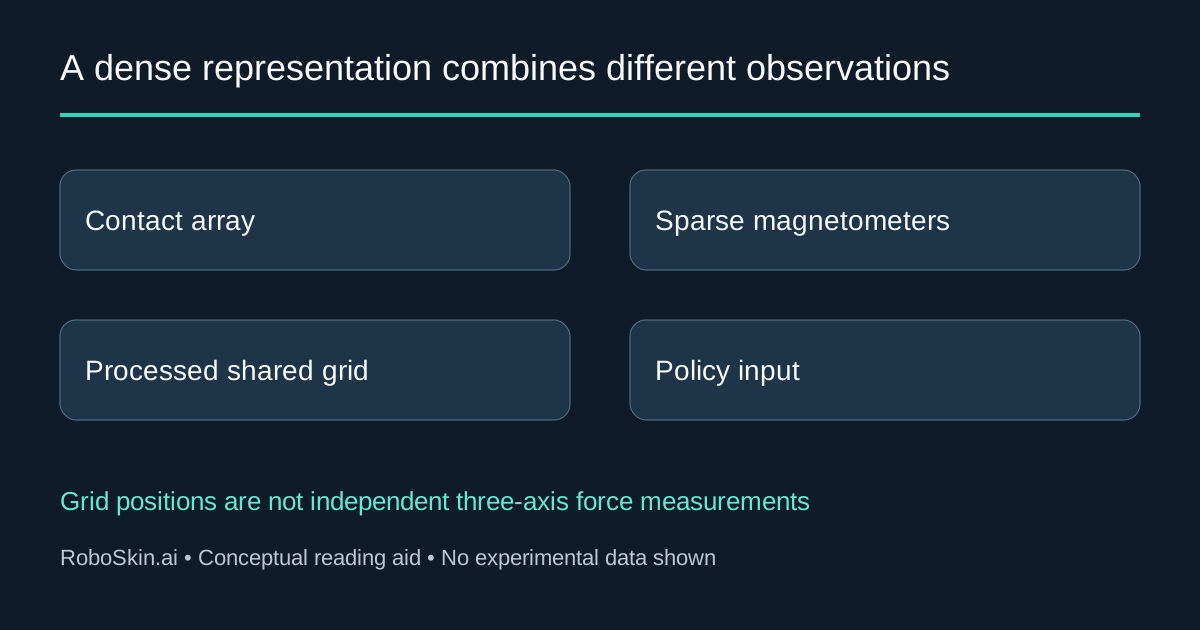
PanoTac combines a dense contact array with sparse magnetic measurements to support touch-centric manipulation. Its central question is useful for sensor selection: when does a policy need the shape of contact, when does it benefit from shear-related information, and what does combining those signals actually measure?
This interpretation was published on November 4, 2026, reviewing Binglin Wang and colleagues' November 2 arXiv v1 preprint. All experimental results are author-reported. RoboSkin.ai reviewed the paper, full text and official project; we did not fabricate a fingertip, install software or test a policy. The practical audience is a lab or integrator choosing observations and an evaluation protocol, not a buyer seeking a verified off-the-shelf specification.
A dense output is not a dense array of independent force measurements
Each fingertip combines a 12 × 32 piezoresistive array with 10 three-axis magnetometers. The method projects their responses into a shared 12 × 32 × 3 representation. That grid has 384 positions, but it does not contain 384 independently measured, calibrated three-axis force vectors. Hardware and representation, Sections III-B–C.
The normal component combines a thresholded, smoothed and normalized contact pattern with the mean absolute magnetic z response. The shear-related x and y responses are placed near magnetometer locations and interpolated across the grid. Thus even the normal representation is a fused signal, rather than simply a raw pressure image. Representation equations.
For a downstream engineer, the distinction affects what may be inferred from a heatmap:
| Data layer | What it represents | What to avoid assuming |
|---|---|---|
| Piezoresistive array | Spatial contact responses at the array locations | Each value is already a calibrated force in newtons |
| Magnetometer observations | Magnetic responses associated with deformation | Every grid location has its own independent magnetic measurement |
| Fused three-channel grid | Processed normal and interpolated shear-related fields | Interpolation creates new independently measured spatial detail |
| Learned policy input | A representation used with vision and robot state | A useful learned cue guarantees metrological accuracy |
This is not an argument against interpolation. It is a reason to preserve the raw observations, calibration and transformation definitions alongside the policy input. A representation may help a controller choose an action without supporting a separate claim of local force accuracy. The sensor-density guide separates measurement locations, channels and effective resolution.
What the manipulation ablations compare
The authors evaluate vision alone, vision with dense normal contact, vision with sparse three-axis magnetic input, and the combined PanoTac representation. Within each task, policies use the same demonstrations. Each policy receives 20 evaluation rollouts per task, giving 60 across three tasks. The table below reproduces the reported complete-task percentages, not conditional success after reaching a particular stage. Experimental setup and Table III.
| Policy input | Test-tube preparation | Grain scooping | Salt pouring | Overall |
|---|---|---|---|---|
| Vision only | 35% | 45% | 55% | 45.0% |
| Vision + dense normal array | 65% | 85% | 70% | 73.3% |
| Vision + sparse three-axis input | 85% | 60% | 90% | 78.3% |
| Vision + PanoTac | 90% | 85% | 100% | 91.7% |
The overall difference from vision alone is 46.7 percentage points, not a 46.7% relative improvement. PanoTac ties the dense-normal baseline on complete grain scooping; its test-tube advantage over sparse three-axis input is one rollout out of 20. The salt-pouring result is 20 successes in the reported evaluation, not an industrial reliability guarantee.
The comparison also changes tactile encoders and feature dimensions: sparse inputs use a different encoder from dense maps. It should not be presented as an identical-capacity model experiment that isolates the causal value of one additional channel. Stage rates include rollouts that failed earlier, so dividing or comparing stages requires retaining the authors' denominator. Table III caption · Policy implementation.
Translate the results into a task-specific question
The authors relate contact patterns to spoon orientation and magnetic responses to stopper release and opaque-bottle contents. Those observations suggest different requirements; they do not establish that every grasp needs the largest tactile tensor. Task analyses.
Our proposed evaluation starts with the failure a team needs to resolve:
| Intended decision | Candidate information to examine | Evidence that would make the comparison useful |
|---|---|---|
| Which way is a partly hidden tool held? | Contact shape and its location on the finger | Matched trials across relevant handles and grasp positions |
| Has a constrained object released? | Changes in contact and shear-related response | A release reference and the action transition, including premature decisions |
| Should the robot pour or discard? | Load-related cues under the actual grasp | Balanced object conditions and full-task outcomes, including placement failures |
| Will the method work on another fingertip? | Geometry, mechanics and calibration of the new assembly | New sensor characterization and policy evidence rather than an unchanged image shape |
These are suggested questions, not additional PanoTac results. Keep vision, demonstrations, resets and assistance comparable; report the cases where tactile input does not help. The tactile-manipulation guide provides the broader observation-to-action framework.
Separate acquisition, policy and robot-control rates
The paper's deployed pipeline acquires tactile data at 60 Hz, aligns streams at 30 Hz, subsamples to a 6 Hz policy, and interpolates actions for a 30 Hz control interface. The current project hardware card advertises up to 100 Hz. Those are source-specific statements, not evidence that the paper ran a 100 Hz closed-loop learned policy. Integration and deployment · Project hardware overview.
Before comparing this system with another sensor, request the exact hardware and firmware configuration, timestamps, processing settings and policy schedule. Record the age of the tactile observation when an action is issued. A faster acquisition specification can coexist with a slower policy, and neither alone establishes contact-to-action latency.
Cost claims need a bill of materials and a common boundary
Paper v1 describes a cost below US$50 per fingertip, excluding readout boards; the project hardware card currently lists US$9.4 per sensor. We did not verify a versioned bill of materials reconciling those scopes. Treat them as author-stated component estimates, not interchangeable prices or a quote for a complete manipulation system. Paper cost scope, Introduction · Project card.
A useful procurement comparison would separately record sensing materials, electronics, fabrication and assembly yield, mounting, calibration fixtures and labor, replacements, computing and robot integration. For two fingertips, do not merely double a component headline and call that the deployment budget. The tactile-sensor selection guide offers a broader requirements framework.
Characterization and hardware limits
The reported load characterization uses three fabricated instances under normal loading. Repeatability and cross-instance variation describe consistency; they are not interchangeable with force accuracy. Magnetic x/y responses observed during normal indentation do not constitute a separate calibrated tangential-load test. The paper also identifies susceptibility to ferromagnetic objects and external magnetic fields. Characterization · Conclusion.
The demonstrated setup uses a parallel-jaw gripper. Extension to dexterous hands remains future work in the paper. Training with magnetic disturbances is discussed as a possible direction, not a quantitatively verified repair. A different cover, fingertip geometry or mounting should therefore trigger fresh characterization rather than inherit the original behavior.
For an engineering comparison with OpenTac's custom-skin approach, keep the sensing mechanism, cover mechanics and readout definitions explicit. These papers answer different integration questions; their headline rates and task scores are not a common leaderboard.
Availability and an adoption decision
On November 4, the official project's Method Code and Hardware Repo controls displayed Coming soon when activated; the page script implements those notices. We did not verify a downloadable implementation, hardware package, weights or their licenses. A visible resource button is not proof of an available, licensed reproduction package. Official project.
PanoTac is most useful as evidence for matching contact geometry and load-related cues to a manipulation decision. Before adoption, identify whether the needed output is a learned cue, a calibrated quantity or both; then obtain the missing artifact, timing and calibration evidence. Teams can use our research-services inquiry to request a source-backed comparison. This review provides no independent hardware performance endorsement.