Python tutorial
Process Tactile Sensor Data with Python: CSV, Heatmaps and Contact Events
Run a hardware-free Python exercise with synthetic tactile CSV data. Validate missing values and timestamps, plot a heatmap, detect teaching contact events and export results.
Read a 47-row synthetic CSV describing 12 frames of a 2 × 2 array. Preserve missing data, plot the usable values and export three teaching contact-event segments. No robot, tactile sensor, GPU or ROS installation is required.
Executed in a fresh virtual environment on Windows x64 with CPython 3.13.3, Matplotlib 3.10.6 and NumPy 2.5.3. Twelve behavior tests passed. The plots and downloadable results below were produced by the supplied script, not drawn as a demonstration.
1. Download a small, complete project
The archive includes process_tactile.py, synthetic_tactile.csv, the deterministic data generator, tests, dependency files, licenses and reference results. Extract it into a new directory before running the commands below.
Matplotlib is the only top-level dependency; its installed dependencies include NumPy. requirements.txt pins Matplotlib, while requirements-lock.txt records every installed dependency from the verified environment. The CSV is independent teaching data: the starter kit’s single 2 × 2 frame has no time series or missing examples, so it cannot demonstrate event boundaries.
2. Run it in an isolated Python environment
Open a terminal inside the extracted python-tactile folder. The Windows commands below match the verified platform and do not require PowerShell activation scripts. Use CPython 3.13.3 for the closest match to the recorded run.
The POSIX equivalent is provided for readers on Linux or macOS; that platform was not executed in this verification. The script uses a noninteractive plotting backend, so no display server or GUI is needed. Results overwrite files of the same name in the selected output directory.
python -m venv .venv
.venv\Scripts\python.exe -m pip install -r requirements-lock.txt
.venv\Scripts\python.exe process_tactile.py --input synthetic_tactile.csv --output results --threshold 0.6
.venv\Scripts\python.exe -m unittest discover -s . -p "test_*.py" -vpython3 -m venv .venv
.venv/bin/python -m pip install -r requirements-lock.txt
.venv/bin/python process_tactile.py --input synthetic_tactile.csv --output results --threshold 0.6
.venv/bin/python -m unittest discover -s . -p "test_*.py" -vframes=12 events=3 unknown_frames=3
wrote processed.csv, frames.csv, contact_events.csv, summary.json, heatmap.png, timeline.png3. Read the data contract before the numbers
Each CSV row describes one taxel at one synthetic time. A taxel is a single sensing element in the logical array. The grid has two rows and two columns; a missing row in the file becomes an unknown cell in that frame.
The sequence was hand-designed and generated by generate_sample.py. It is neither real acquisition nor a physical simulation. Its 100 ms spacing is a chosen fixture interval, not a measured sensor rate.
| Field | Contract |
|---|---|
| timestamp_ns | Integer nanoseconds from the synthetic sequence origin. Repeated across taxels in a frame; nonnegative and nondecreasing in file order. Not Unix time, receive time or measured latency. |
| sensor_id | teaching_surface for this file. This small processor accepts one sensor per input. |
| row / column | Zero-based logical taxel coordinates in the declared 2 × 2 grid, not physical positions. |
| value | A dimensionless teaching signal in [0, 1] when usable. A blank is missing. |
| unit | normalized. The processor rejects other units rather than silently applying the same threshold to force or pressure. |
| valid | 1 means usable at source; 0 means invalid or masked. The loader still checks a value marked 1 for missing, nonfinite or out-of-range data. |
4. Preserve uncertainty during quality checks
load_frames rejects duplicate timestamp/taxel pairs, negative or backwards timestamps, noninteger times, invalid coordinates, mixed sensors, unsupported units and invalid validity flags. It does not silently sort a malformed recording.
A missing taxel, blank value, nonfinite number, out-of-range normalized number or valid=0 becomes an unknown usable value. The raw text and source validity flag remain in processed.csv; unknown usable_value cells are blank, not zero.
The supplied data has one invalid flag, one absent taxel and one blank numeric value. It produces 48 output cells: 45 usable and three unknown. Frames containing only subthreshold observations are called clear only when all taxels are usable.
5. Inspect the heatmap and time series
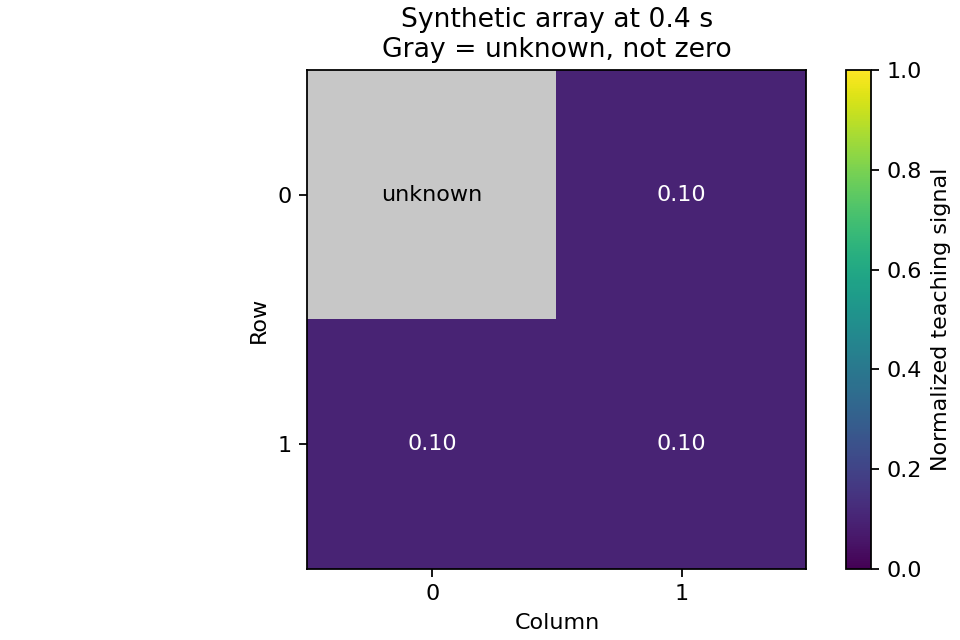
The script deliberately plots the first incomplete frame: 0.4 s. Its unusable 0.95 entry is gray and labelled unknown. It does not appear as high contact or as a zero-valued taxel.
The color scale is fixed to [0, 1] and labelled as a normalized teaching signal. It is not pressure in pascals or force in newtons.
6. Apply a transparent teaching threshold
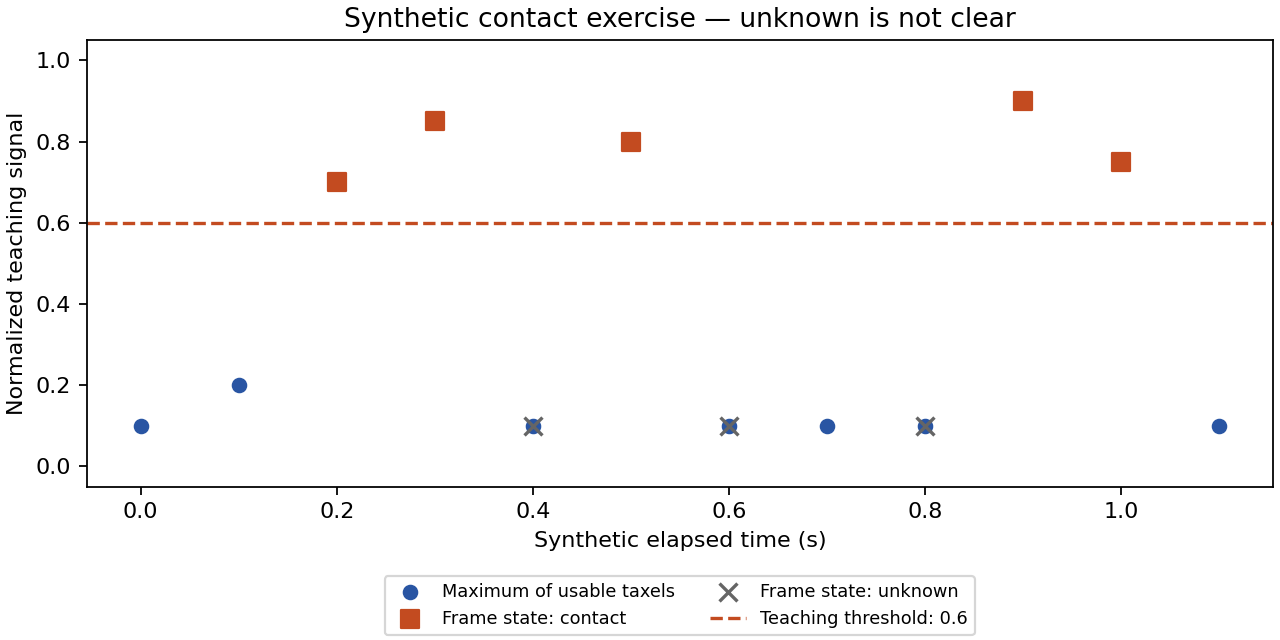
A frame is contact when at least one usable taxel is greater than or equal to 0.6. It is clear when every taxel is usable and below the threshold. Otherwise it is unknown. A known high taxel can establish a threshold crossing even when another cell is missing, but incomplete low values cannot establish absence of contact.
Unknown frames split events. A gap longer than --max-gap-ms (150 by default) also splits them. If an event begins without a preceding clear frame, left_censored is true: its true start was not observed. If it ends at unknown data, a time gap or the recording boundary, right_censored is true.
The output has three segments: 0.2–0.3 s, 0.5 s, and 0.9–1.0 s. observed_span_ms measures the span between observed contact frames, not physical contact duration. The first two segments end at unknown frames; the last has a clear observation at 1.1 s. Missing data may divide one physical contact into multiple observed segments.
This rule has no hardware calibration, hysteresis, denoising or validated detection accuracy. Changing --threshold is an experiment in this fixture, not a sensor calibration procedure.
7. Carry the contract into ROS 2 and dataset work
The starter kit uses a channel-major TactileArray message with rows, columns, channel names, units and one validity byte per taxel. This exercise shares the concepts of ordered taxels and explicit validity, but is not a direct export of that ROS stream.
For a future single-channel adapter, values would be arranged as ((channel × rows) + row) × columns + column, with channels=[signal] and units=[normalized]. Map unknown cells to valid=0 and define their numeric payload convention with the consumer; never treat a placeholder as a measurement. A multichannel stream needs a deliberate policy because the starter kit has a per-taxel, not per-channel, validity mask.
Document a ROS clock domain and frame geometry before adapting timestamp_ns or sensor_id. Do not label this elapsed synthetic timestamp as a physical measurement or use it to calculate latency. No CSV-to-ROS publisher is included or claimed here; the ROS guide supplies the actual starter-kit publishing and recording workflow.
For research data, inspect the original schema, data license, calibration, sequence boundaries and split policy before adapting this reader. The tiny synthetic fixture is a software exercise, not a tactile learning benchmark.
Tests, troubleshooting and licenses
The 12 behavior tests cover invalid high values, missing and nonfinite values, range violations, missing cells, partial-frame contact, duplicates, malformed timestamps, layout and unit rejection, inclusive threshold crossings, unknown boundaries, time gaps, empty input and invalid parameters. They run without importing Matplotlib.
If installation fails, check your Python version and the wheel availability for your operating system. If the script prints Input error, inspect the identified line before changing the grid or unit. A CSV opened and resaved by a spreadsheet can change integer timestamps or headers; keep an untouched copy.
Code and original tutorial documentation are Apache-2.0. The independently generated synthetic CSV and original generated results are CC0-1.0. The starter kit remains a separate Apache-2.0 project and retains its own authorship. This tutorial is by the RoboSkin.ai editorial team; it does not attribute its teaching data to research-paper authors.
8. Connect quality checks to calibration and episodes
These independently generated normalized CSV signals are not calibrated force. For real sensors, first choose and validate an image, depth or force target, then preserve the raw unit, calibration revision and validity mask.
For robot-learning exports, segment observations and actions into episodes and check timing and vector dimensions. The separate LeRobot numeric fixture also uses a small logical array, but has its own schema and arbitrary-unit contract; it is not a direct conversion of this CSV.
Complete Python script
This is the full downloadable process_tactile.py. Input validation and event analysis are ordinary Python; Matplotlib is imported only when generating plots.
Read the complete script (231 lines)
#!/usr/bin/env python3
"""Synthetic tactile CSV exercise. Copyright 2026 RoboSkin.ai. Apache-2.0.

Values are normalized teaching signals, not force/pressure measurements.
Unknown data stays unknown. Event boundaries are observations, not ground truth.
"""
import argparse
import csv
import json
import math
from pathlib import Path

FIELDS = ["timestamp_ns", "sensor_id", "row", "column", "value", "unit", "valid"]


def load_frames(path, rows=2, columns=2):
    """Reject ambiguous layout/time; preserve missing and invalid observations."""
    if rows <= 0 or columns <= 0:
        raise ValueError("rows and columns must be positive")
    frames = []
    sensor_id = None
    last_timestamp = -1
    with Path(path).open(encoding="utf-8-sig", newline="") as handle:
        reader = csv.DictReader(handle)
        if reader.fieldnames != FIELDS:
            raise ValueError("CSV header must be: " + ",".join(FIELDS))
        for line, item in enumerate(reader, 2):
            if None in item or any(value is None for value in item.values()):
                raise ValueError(f"line {line}: wrong number of columns")
            try:
                timestamp = int(item["timestamp_ns"])
                row, column = int(item["row"]), int(item["column"])
            except ValueError as exc:
                raise ValueError(f"line {line}: timestamp and coordinates must be integers") from exc
            if timestamp < 0 or timestamp < last_timestamp:
                raise ValueError(f"line {line}: timestamps must be nonnegative and ordered")
            if not (0 <= row < rows and 0 <= column < columns):
                raise ValueError(f"line {line}: taxel outside declared grid")
            if not item["sensor_id"].strip():
                raise ValueError(f"line {line}: sensor_id is required")
            if sensor_id is None:
                sensor_id = item["sensor_id"]
            if item["sensor_id"] != sensor_id:
                raise ValueError(f"line {line}: this exercise accepts one sensor per file")
            if item["unit"] != "normalized":
                raise ValueError(f"line {line}: this teaching threshold requires unit=normalized")
            if item["valid"] not in ("0", "1"):
                raise ValueError(f"line {line}: valid must be 0 or 1")
            if timestamp != last_timestamp:
                frames.append({"timestamp_ns": timestamp, "sensor_id": sensor_id, "cells": {}})
            cells = frames[-1]["cells"]
            key = (row, column)
            if key in cells:
                raise ValueError(f"line {line}: duplicate timestamp/taxel")
            raw = item["value"].strip()
            try:
                value = float(raw) if raw else None
            except ValueError as exc:
                raise ValueError(f"line {line}: value must be numeric or blank") from exc
            if item["valid"] == "0":
                status = "invalid_flag"
            elif value is None:
                status = "missing_value"
            elif not math.isfinite(value):
                status = "nonfinite_value"
            elif not 0 <= value <= 1:
                status = "out_of_range"
            else:
                status = "usable"
            cells[key] = {"raw_value": raw, "source_valid": item["valid"],
                          "value": value if status == "usable" else None, "status": status}
            last_timestamp = timestamp
    if not frames:
        raise ValueError("CSV must contain at least one observation")
    for frame in frames:
        for row in range(rows):
            for column in range(columns):
                frame["cells"].setdefault((row, column), {
                    "raw_value": "", "source_valid": "", "value": None, "status": "missing_taxel"})
    return frames


def analyze(frames, threshold=0.6, max_gap_ms=150.0):
    """A known high taxel proves threshold contact; incomplete low frames are unknown."""
    if not math.isfinite(threshold) or not 0 < threshold <= 1:
        raise ValueError("threshold must be finite and in (0, 1]")
    if not math.isfinite(max_gap_ms) or max_gap_ms <= 0:
        raise ValueError("max-gap-ms must be finite and positive")
    max_gap_ns = round(max_gap_ms * 1_000_000)
    frame_rows, events, quality = [], [], {}
    active = None
    previous_timestamp = None
    previous_state = "unknown"

    def finish(reason, boundary_timestamp):
        nonlocal active
        if active is not None:
            active["end_reason"] = reason
            active["right_censored"] = reason != "release_observed"
            active["boundary_timestamp_ns"] = boundary_timestamp
            active["observed_span_ms"] = (active["last_contact_ns"] - active["first_contact_ns"]) / 1e6
            events.append(active)
            active = None

    for frame in frames:
        timestamp = frame["timestamp_ns"]
        gap = previous_timestamp is not None and timestamp - previous_timestamp > max_gap_ns
        if gap:
            finish("time_gap", timestamp)
            previous_state = "unknown"
        values = []
        for cell in frame["cells"].values():
            quality[cell["status"]] = quality.get(cell["status"], 0) + 1
            if cell["value"] is not None:
                values.append(cell["value"])
        maximum = max(values) if values else None
        if maximum is not None and maximum >= threshold:
            state = "contact"
        elif len(values) == len(frame["cells"]):
            state = "clear"
        else:
            state = "unknown"
        frame_rows.append({"timestamp_ns": timestamp, "usable_taxels": len(values),
                           "total_taxels": len(frame["cells"]), "max_value": maximum,
                           "contact_state": state, "gap_before": gap})
        if state == "contact":
            if active is None:
                active = {"event_id": len(events) + 1, "first_contact_ns": timestamp,
                          "last_contact_ns": timestamp, "peak_value": maximum,
                          "left_censored": previous_state != "clear"}
            active["last_contact_ns"] = timestamp
            active["peak_value"] = max(active["peak_value"], maximum)
        else:
            finish("release_observed" if state == "clear" else "unknown_frame", timestamp)
        previous_timestamp, previous_state = timestamp, state
    finish("end_of_recording", "")
    summary = {"synthetic": True, "unit": "normalized", "threshold": threshold,
               "max_gap_ms": max_gap_ms, "frames": len(frames), "events": len(events),
               "unknown_frames": sum(row["contact_state"] == "unknown" for row in frame_rows),
               "contact_frames": sum(row["contact_state"] == "contact" for row in frame_rows),
               "quality_counts": quality}
    return frame_rows, events, summary


def write_csv(path, fieldnames, rows):
    with Path(path).open("w", encoding="utf-8", newline="") as handle:
        writer = csv.DictWriter(handle, fieldnames=fieldnames)
        writer.writeheader()
        writer.writerows(rows)


def plot_frames(frames, frame_rows, output, rows, columns, threshold):
    import matplotlib
    matplotlib.use("Agg")
    import matplotlib.pyplot as plt
    import numpy as np  # Installed by Matplotlib; used only to mask unknown plot cells.

    # Show the first incomplete frame so the missing-data policy is visible.
    chosen = next((f for f in frames if any(c["value"] is None for c in f["cells"].values())), frames[0])
    grid = np.full((rows, columns), np.nan)
    for (row, column), cell in chosen["cells"].items():
        if cell["value"] is not None:
            grid[row, column] = cell["value"]
    cmap = plt.get_cmap("viridis").copy()
    cmap.set_bad("#c7c7c7")
    fig, ax = plt.subplots(figsize=(6, 4), layout="constrained")
    heatmap = ax.imshow(np.ma.masked_invalid(grid), vmin=0, vmax=1, cmap=cmap)
    for row in range(rows):
        for column in range(columns):
            value = grid[row, column]
            ax.text(column, row, "unknown" if np.isnan(value) else f"{value:.2f}",
                    ha="center", va="center", color="black" if np.isnan(value) or value > .6 else "white")
    ax.set(xticks=range(columns), yticks=range(rows), xlabel="Column", ylabel="Row",
           title=f"Synthetic array at {chosen['timestamp_ns'] / 1e9:g} s\nGray = unknown, not zero")
    fig.colorbar(heatmap, ax=ax, label="Normalized teaching signal")
    fig.savefig(output / "heatmap.png", dpi=160)
    plt.close(fig)

    times = [(f["timestamp_ns"] - frames[0]["timestamp_ns"]) / 1e9 for f in frames]
    maxima = [f["max_value"] if f["max_value"] is not None else float("nan") for f in frame_rows]
    fig, ax = plt.subplots(figsize=(8, 4), layout="constrained")
    # Points avoid suggesting interpolation across missing observations or time gaps.
    ax.scatter(times, maxima, label="Maximum of usable taxels", color="#2955a3", marker="o")
    for state, color, marker in [("contact", "#c34b20", "s"), ("unknown", "#656565", "x")]:
        selected = [i for i, f in enumerate(frame_rows) if f["contact_state"] == state]
        ax.scatter([times[i] for i in selected], [maxima[i] for i in selected],
                   label=f"Frame state: {state}", color=color, marker=marker, s=65)
    ax.axhline(threshold, color="#c34b20", linestyle="--", label=f"Teaching threshold: {threshold:g}")
    ax.set(xlabel="Synthetic elapsed time (s)", ylabel="Normalized teaching signal", ylim=(-.05, 1.05),
           title="Synthetic contact exercise — unknown is not clear")
    ax.legend(loc="upper center", bbox_to_anchor=(0.5, -0.18), ncol=2, fontsize=8)
    fig.savefig(output / "timeline.png", dpi=160)
    plt.close(fig)


def main():
    parser = argparse.ArgumentParser(description=__doc__)
    parser.add_argument("--input", type=Path, default=Path(__file__).with_name("synthetic_tactile.csv"))
    parser.add_argument("--output", type=Path, default=Path("results"))
    parser.add_argument("--rows", type=int, default=2)
    parser.add_argument("--columns", type=int, default=2)
    parser.add_argument("--threshold", type=float, default=0.6)
    parser.add_argument("--max-gap-ms", type=float, default=150.0)
    args = parser.parse_args()
    try:
        frames = load_frames(args.input, args.rows, args.columns)
        frame_rows, events, summary = analyze(frames, args.threshold, args.max_gap_ms)
    except (ValueError, OSError) as exc:
        parser.exit(2, f"Input error: {exc}\n")
    args.output.mkdir(parents=True, exist_ok=True)
    processed = []
    for frame in frames:
        for (row, column), cell in sorted(frame["cells"].items()):
            processed.append({"timestamp_ns": frame["timestamp_ns"], "sensor_id": frame["sensor_id"],
                              "row": row, "column": column, "raw_value": cell["raw_value"],
                              "source_valid": cell["source_valid"], "usable_value": cell["value"],
                              "unit": "normalized", "status": cell["status"]})
    write_csv(args.output / "processed.csv", list(processed[0]), processed)
    write_csv(args.output / "frames.csv", list(frame_rows[0]), frame_rows)
    write_csv(args.output / "contact_events.csv", ["event_id", "first_contact_ns", "last_contact_ns",
              "peak_value", "left_censored", "end_reason", "right_censored", "boundary_timestamp_ns",
              "observed_span_ms"], events)
    (args.output / "summary.json").write_text(json.dumps(summary, indent=2) + "\n", encoding="utf-8")
    plot_frames(frames, frame_rows, args.output, args.rows, args.columns, args.threshold)
    print(f"frames={summary['frames']} events={summary['events']} unknown_frames={summary['unknown_frames']}")
    print("wrote processed.csv, frames.csv, contact_events.csv, summary.json, heatmap.png, timeline.png")


if __name__ == "__main__":
    main()
Common questions
Does a zero mean missing data?
No. Zero is a possible valid normalized value. Missing and invalid values remain unknown, with an explicit status and a blank usable_value in the processed CSV.
Are these values pressure or force?
No. They are dimensionless synthetic teaching values. No conversion to newtons or pascals is justified by this exercise.
Can I use the threshold on my sensor?
Not without a separate sensor-specific design and validation. The 0.6 threshold demonstrates event logic only; it is not a calibrated detector.
Next steps
- Robotics programming learning path →
Connect first programs, middleware and sensor feedback.
- Publish and replay tactile messages in ROS 2 →
Source-checked starter-kit walkthrough; local ROS runtime validation is pending.
- Tactile dataset directory →
Choose real research data with documented sources and licenses.